
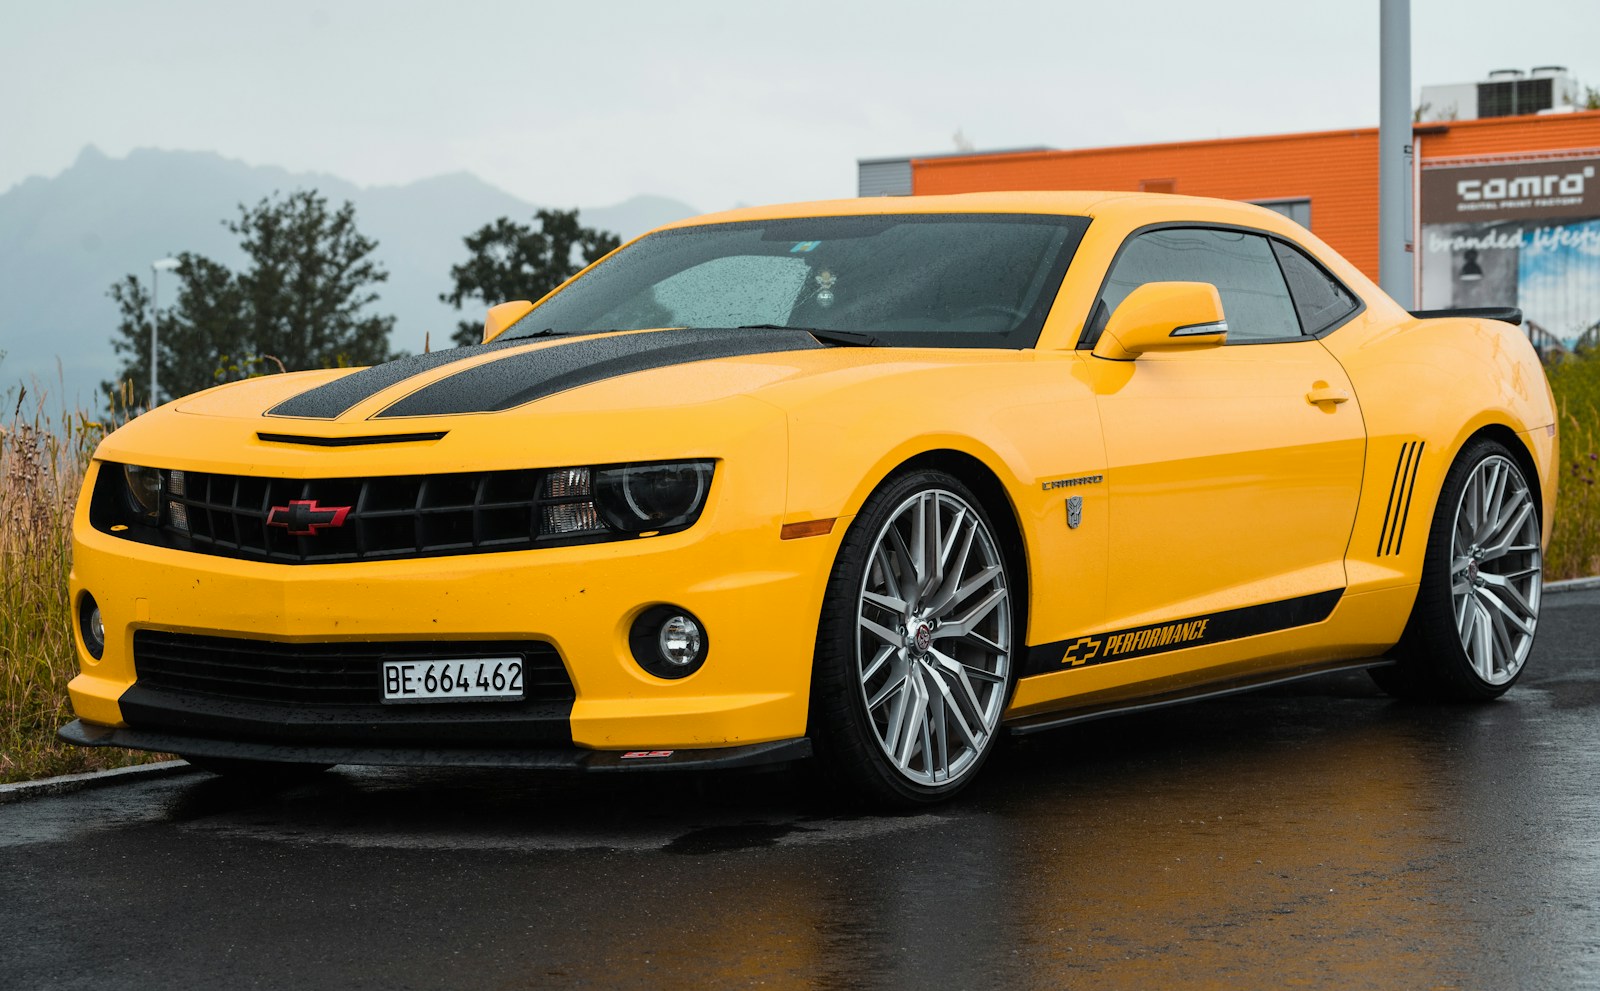

A Chevrolet Camaro ZL1 and a Ford Mustang GT can sit a few thousand dollars apart on the window sticker and still land nowhere near each other on your insurance bill, because insurers aren’t pricing the badge. They’re pricing what happens after you drive off the lot. The Highway Loss Data Institute’s own whole-vehicle theft data puts the standard Camaro’s relative claim frequency around 13 times the average for all passenger vehicles, and the Camaro ZL1 close to 40 times the average, according to HLDI’s whole vehicle theft losses report. That single number does more to set your premium than the number printed on the Monroney label ever will. You’re not being quoted on what you paid for the car. You’re being quoted on what the car is statistically likely to cost the insurer.
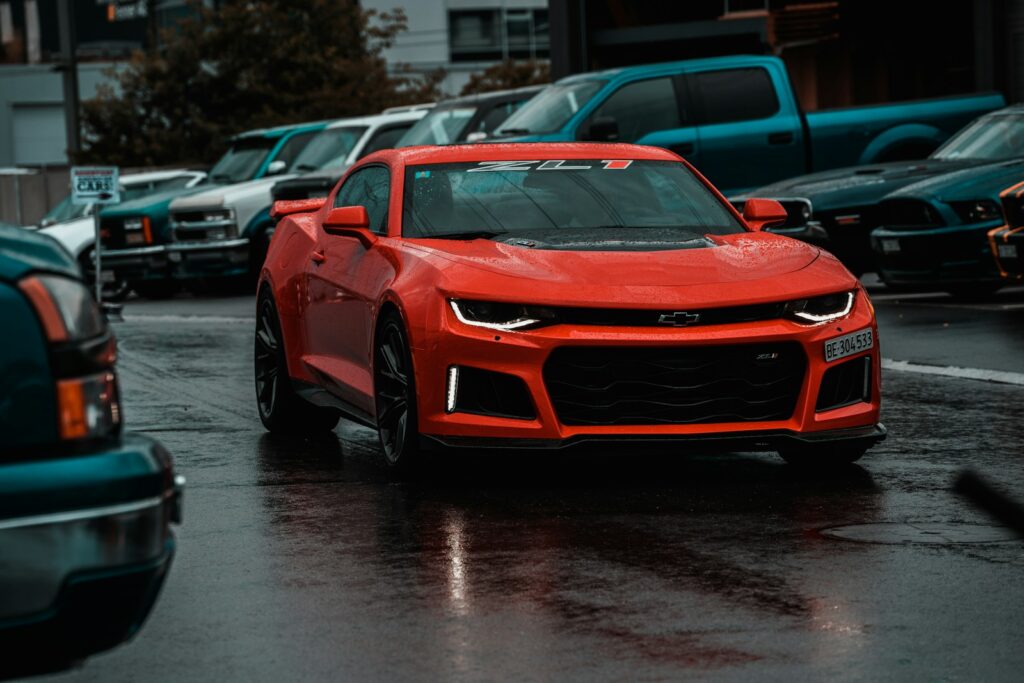
The Sticker Price Is the Wrong Variable to Watch
The Insurance Information Institute’s own consumer data shows just how much variance exists in what Americans pay for coverage before you even get into vehicle-specific factors: the national average full-coverage expenditure sits well above $1,200 a year, and it swings by hundreds of dollars between states for reasons that have nothing to do with the car itself, according to III’s facts and statistics on auto insurance. Layer a pony car on top of that baseline and the math gets more specific. The Insurance Institute for Highway Safety’s own methodology page explains that collision, comprehensive and property-damage loss ratings reflect both how often a model generates a claim and how expensive that claim tends to be once it’s filed, according to IIHS’s insurance losses by make and model explainer. A cheaper sticker tells you nothing about either half of that equation.
Theft Exposure Is Doing More Work Than You’d Guess
Pony cars and their muscle-car cousins have become disproportionately attractive targets, and that shows up directly in comprehensive premiums because comprehensive coverage is what pays out on a stolen vehicle. HLDI’s theft data shows a Dodge Charger SRT Hellcat generating roughly 25 whole-vehicle theft claims per 1,000 insured vehicle years across recent model years, a figure high enough that owners in higher-theft metro markets have reported full-coverage quotes climbing toward the $600-a-month range, according to reporting on the same HLDI dataset by Insurance Business America. Compare that to the electrified end of the lineup. HLDI’s own numbers put the Ford Mustang Mach-E’s theft claim frequency in the single digits relative to the same 100-point average scale that puts the Camaro ZL1 near 3,949, a gap of multiple orders of magnitude between a gas-powered pony car and its electric relative wearing a similar badge. An electrified successor simply isn’t the theft target its combustion sibling is, at least not yet, and the premium reflects that even when the electric version’s MSRP is higher.
Horsepower and Repair Cost Do the Rest
Theft isn’t the only lever. Higher-output trims like the ZL1, GT500-era Shelby models and Hellcat-badged Chargers carry more expensive components under the skin, from wider forged wheels to upgraded brakes to supercharger hardware, all of which raise the average payout per collision claim even when the claim frequency doesn’t move much. That’s the second half of IIHS’s stated methodology: claim frequency and claim severity both feed the loss rating, and a car engineered to go faster tends to get into more expensive accidents when it does crash, not just more frequent ones. Combine that with a theft rate multiple times the industry average and you get muscle-car and pony-car insurance quotes that can run a few hundred dollars a month above what a visually similar but lower-output trim of the same nameplate would cost, according to the same Insurance Business America reporting on national average full-coverage premiums split between a roughly $2,500 baseline for a Mustang GT and closer to $3,000 for a Camaro ZL1.
Why the Two Numbers on the Deal Never Actually Match
None of this means the cheaper car on the lot is secretly the more expensive one to own. It means the sticker and the insurance quote are answering two completely different questions. One reflects what the automaker thinks the market will pay for the hardware. The other reflects what an actuary thinks that specific hardware, in that specific trim, parked in your specific zip code, is statistically going to cost someone else to replace or repair. Two pony cars can share a platform, a rough price point and a badge lineage and still diverge sharply the moment an insurer runs the VIN, because the VIN carries theft history, claims history and trim-level performance data that the window sticker was never built to disclose in the first place.