


Theft data doesn’t just sit in an annual report anymore. It moves directly into how insurers decide who they’ll cover at all. When theft claims on certain Hyundai and Kia models spiked more than eleven-fold between the first half of 2020 and the second half of 2023, according to the Insurance Institute for Highway Safety’s own analysis of Highway Loss Data Institute claims data, at least three major national carriers responded by pulling back coverage rather than just raising the price of it. Allstate, Progressive and State Farm each confirmed they had stopped issuing new policies in some states for specific Hyundai and Kia models, according to NPR’s reporting on the insurers’ own statements. That’s a level of underwriting response most drivers never see coming until they’re the one getting turned away, and it traces in a straight line back to theft-rate data that agencies like the National Insurance Crime Bureau and HLDI publish every year.
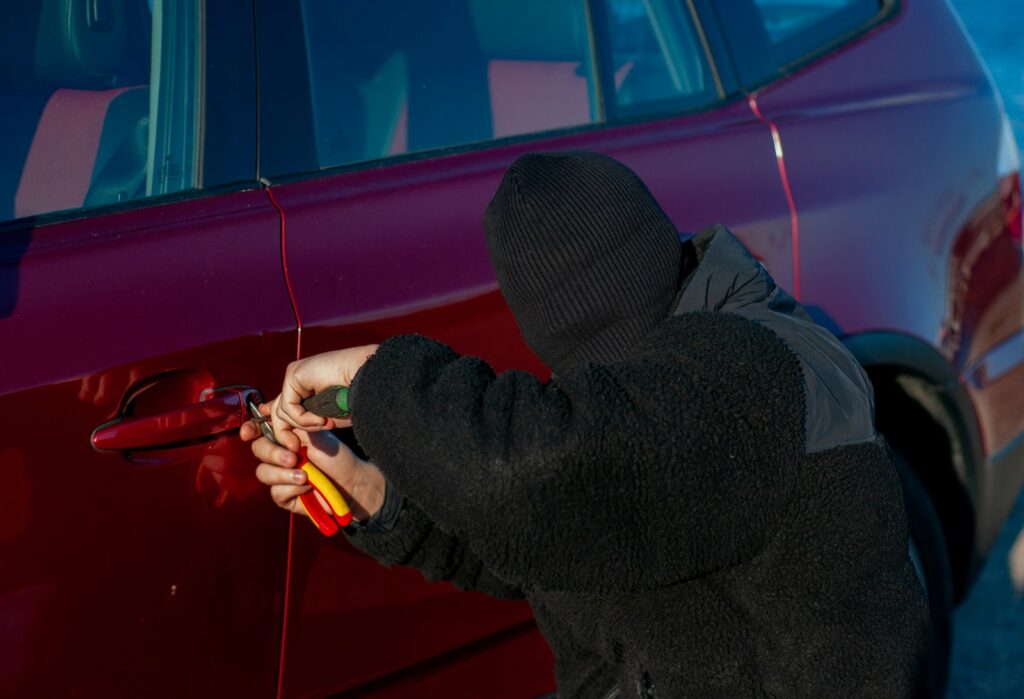
How a Theft Statistic Turns Into an Underwriting Decision
The National Insurance Crime Bureau’s Hot Wheels report and HLDI’s theft claims data measure two related but distinct things, and understanding the difference explains why insurers react the way they do. NICB counts vehicles reported stolen to law enforcement through the FBI’s National Crime Information Center, regardless of whether the vehicle was even insured for theft, while HLDI tracks actual insurance claims paid out for theft losses, according to NICB’s own explainer on how the two reports differ. It’s the HLDI side of that data, the claims insurers actually have to pay, that feeds directly into underwriting models. When a model’s whole-vehicle theft claim frequency jumps into double-digit multiples of the industry average, insurers aren’t reacting to a headline. They’re reacting to their own claims ledger.
The Hyundai-Kia Case Shows the Mechanism in Real Time
The 2021-2022 surge in Hyundai and Kia thefts, driven by a viral social media trend exploiting a missing engine immobilizer on certain models, gives one of the clearest documented examples of theft data reshaping coverage availability rather than just premiums. IIHS-HLDI’s own research found theft claim frequency for affected models had climbed more than elevenfold versus early 2020 levels before the manufacturers’ fix took hold, per the IIHS-HLDI news release on the theft trend. NPR’s reporting on the fallout found Allstate telling customers in Colorado that liability coverage remained available on affected vehicles while comprehensive and collision coverage did not, and found State Farm had paused new coverage on popular models including the Elantra, Tucson, Optima and Sportage in some states. Hyundai and Kia responded with a free anti-theft software update plus steering-wheel locks distributed through participating police departments, and the fix worked: HLDI’s own data, once enough vehicles were updated, showed whole-vehicle theft claims falling 64% among updated cars, per the same IIHS-HLDI release.
Underwriting Now Watches the Same Numbers You Should
What that episode demonstrates is a pipeline that runs from raw theft counts to claims data to real coverage decisions, all without a single new law being passed. NICB’s own data shows theft patterns shift meaningfully year to year — the agency’s reporting on 2020 theft data recorded double-digit percentage jumps for several full-size trucks and SUVs compared with the year before. That’s the kind of swing that shows up in an insurer’s loss ratios well before most owners notice anything has changed. An insurer doesn’t need a regulator to tell it to tighten underwriting on a model with a runaway theft rate; the claims data does that on its own, and it moves faster than most owners’ awareness of their own car’s risk profile.
The Data Trail Runs Ahead of the Sticker Shock
None of this means every high-theft model will get you dropped or denied — most owners on an existing policy simply see a renewal quote climb quietly. But the Hyundai-Kia episode shows the mechanism is real and fast. A viral theft trend, a spike in HLDI’s claims data, and within roughly a year, named national insurers were restricting new business on specific models in specific states. Anti-theft hardware and software fixes are what eventually reversed the trend in the claims data itself. For an owner of any high-theft model, the practical lesson isn’t paranoia. It’s that the same NICB and HLDI numbers publicly available today are the exact numbers your insurer is already watching, usually well before that shift shows up as a line item on your renewal notice.