
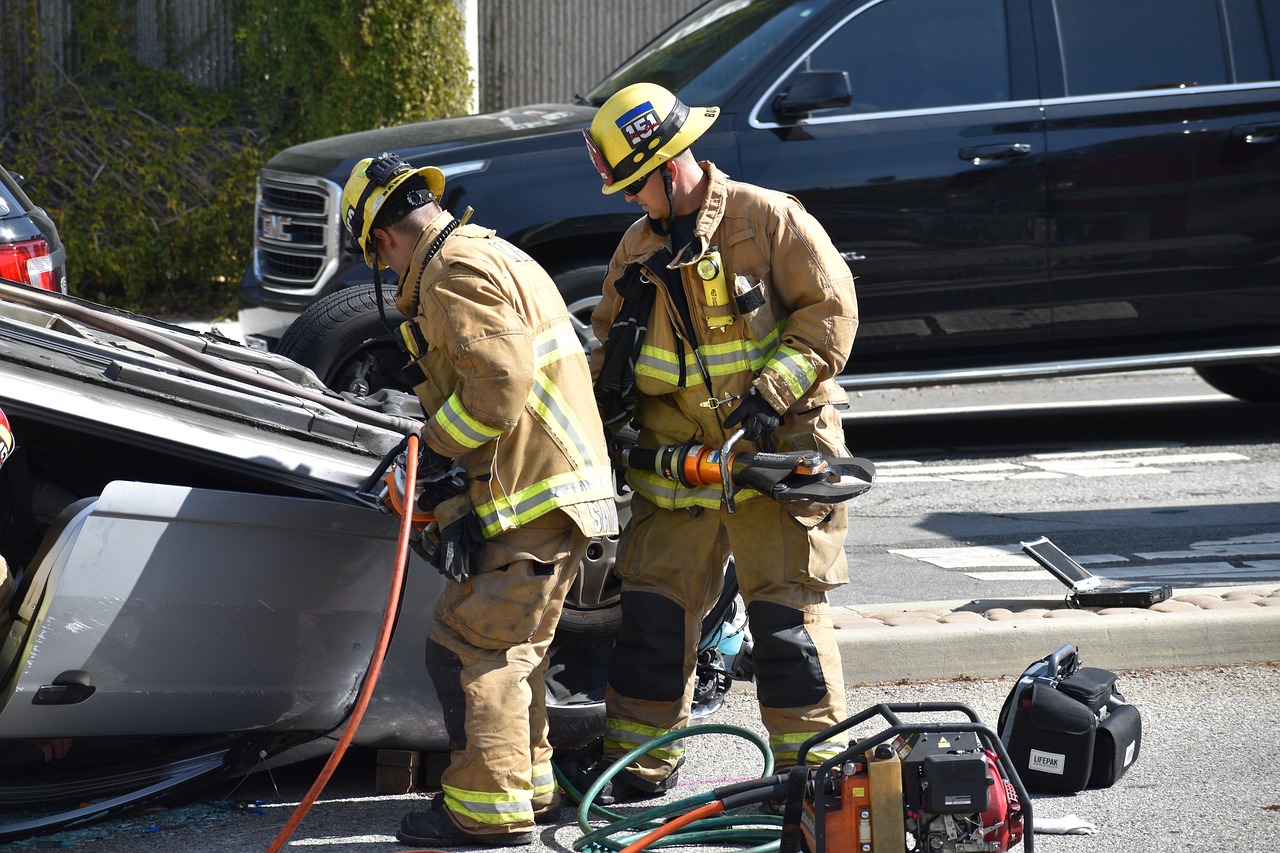
Insurance data has a way of cutting through brand loyalty, and the latest crash numbers do exactly that. A new report on accident and incident rates by car brand and model is reshuffling assumptions about which vehicles are really getting into trouble on American roads. Some of the most accident-prone cars are not obscure beaters, but popular small SUVs, buzzy EVs, and even high-end sports cars that many drivers assumed were among the safest choices.
Instead of focusing on viral dashcam clips or social media outrage, the new rankings lean on hard numbers from insurance records and crash statistics. When those figures are lined up, a few names keep popping up at the top of the lists, from the Kia Soul EV to the Hyundai Venue and several Tesla models. The result is a picture of risk that feels at odds with marketing slogans, and it is forcing drivers to rethink what they thought they knew about “safe” cars.
How insurers actually decide which cars are “trouble”
Behind every viral list of “worst drivers” is a pretty dry spreadsheet of claims, violations, and at-fault crashes. Insurers track how often drivers of each brand file claims for collisions, speeding tickets, DUIs, and other incidents, then compare those numbers to the total number of policyholders for that brand. One recent analysis of insurance records broke out which badges had the highest share of drivers with accidents or serious violations on their record, using that incident rate as a proxy for how risky each brand’s real-world driving tends to be, and the underlying methodology is laid out in detail in the broader brand incidents study.
Separate crash research looks at outcomes rather than just fender benders, tracking how many fatal accidents each model is involved in per billion miles driven. That is how analysts can say, for example, that one small SUV has nearly five times the industry average rate of deadly crashes, while another model sits closer to the norm. Together with broader crash statistics showing that Passenger vehicles, which include sedans, SUVs, and pickups, make up 92% of registered vehicles and are involved in the majority of crashes, the insurance data gives a brand-by-brand snapshot of where risk really clusters.
The brands topping the “worst drivers” list
When analysts sorted those insurance records by incident rate, three names jumped out at the top: Tesla, Ram, and Subaru. In the breakdown of brand performance, the report bluntly states that “Tesla, Ram, Subaru,” a framing that has fueled plenty of online debate among owners. The same research notes that Mercury, Pontiac, and Cadillac drivers show the lowest accident and violation rates, which is not the hierarchy most people would sketch out if asked to rank “responsible” brands from memory.
Those brand-level findings line up with a broader version of the same analysis, which also highlights how some badges attract more aggressive or distracted drivers than others. The underlying incident data shows that some brands have a higher share of drivers with at-fault crashes, while others skew toward speeding or other violations. That mix matters for insurers, who price policies around how often and how severely drivers get into trouble, not just how flashy the badge looks in a showroom.
The specific models most likely to crash
Brand reputations are one thing, but the real shock comes when the data zooms in on individual models. A ranking of the most accident-prone vehicles in the United States found that “Topping the list is the Kia Soul EV, with an accident rate of 15.14% in 2024,” meaning more than one in seven insured examples had a crash claim in that period. Coming in next are the Mazda Mazdasp models, which also post double digit accident rates, followed by a mix of compact crossovers and small EVs that many buyers pick specifically because they seem like sensible, city friendly choices.
Those model level rankings are echoed in a broader crash statistics review that labels the Kia Soul EV as one of the “Most Accident-Prone Models (2024)” and lists its accident rate as 15.14%, ahead of other high risk entries like the number 3 model at 12.57% and the Chevrolet Bolt EUV at 11.75%. The same ranking notes that vehicle type alone is not a clear predictor of crash risk, which is why a compact EV like the Kia Soul EV can sit above larger crossovers and sedans that might look more intimidating on the road.
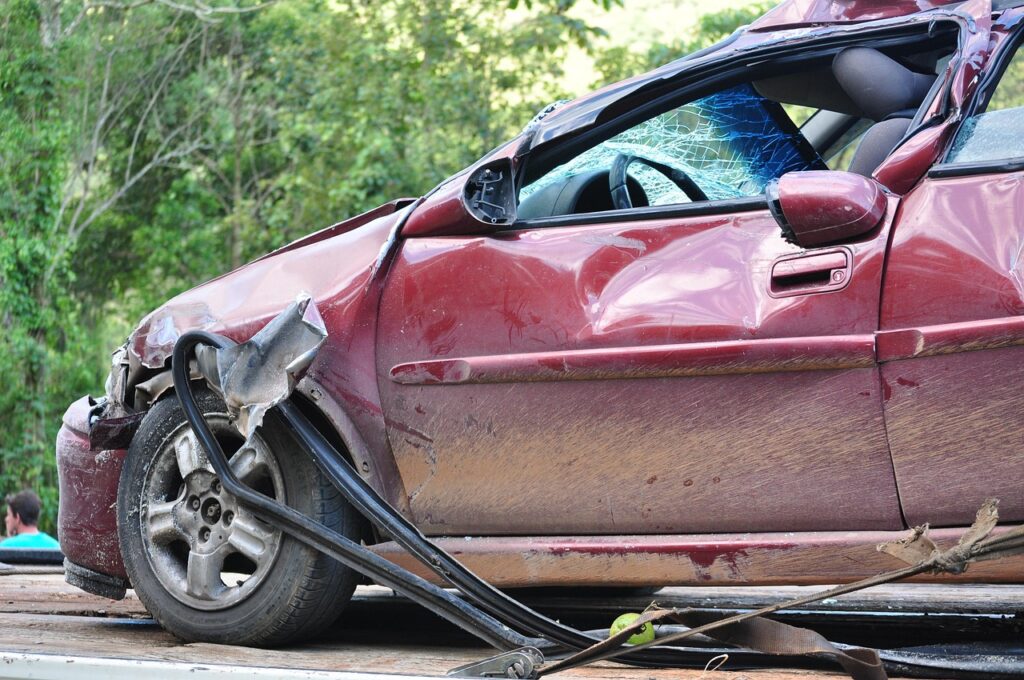
When “dangerous” means deadly, not just dented
Accident rates tell one story, but fatal crash data tells a harsher one. A detailed study of deadly crashes per billion miles driven flagged a group of models with especially troubling records, summarized in its own set of Highlights. At the top of that list sits the Hyundai Venue, which the analysis says leads with 13.9 fatal accidents per billion miles traveled, nearly five times higher than the industry average. Four other vehicles, the Chevrolet Corvette, Mitsubishi Mirage, Porsche 911, and Honda CR-V Hybrid, also exceed average fatality rates by more than 4.5 times, a cluster that spans everything from tiny budget cars to high performance sports models.
Those findings are reinforced by a separate breakdown that again names the Hyundai Venue, Chevrolet Corvette, Mitsubishi Mirage, Porsche 911, and Hond models among the most dangerous, using the same per mile fatal crash metric. The broader analysis notes that small SUVs and subcompact cars show disproportionately high fatality rates, with vehicle size and weight playing crucial roles in crash outcomes. That is a sobering counterpoint to the idea that any modern car with a five star rating is “safe enough,” because the numbers suggest that some designs still leave occupants more exposed when things go very wrong.
Tesla’s split screen image: tech leader and crash magnet
Few brands inspire stronger opinions than Tesla, and the new insurance report adds more fuel to that fire. On one side, Tesla markets its vehicles as cutting edge, with advanced driver assistance and over the air updates that promise constant improvement. On the other, the brand shows up at the top of the incident rate rankings, with the insurance study explicitly stating that “Tesla, Ram, Subaru,” a line that has been widely shared by critics and fans alike.
Crash outcome data adds another layer. A widely shared safety breakdown notes that the Tesla Model Y records 10.6 fatal crashes per billion miles, while the Model S doubles the industry average, placing both in a group of vehicles with elevated fatality rates despite their modern safety tech. That tension between image and outcome is especially striking given how heavily Tesla leans on its software and safety messaging. It also raises uncomfortable questions about how drivers actually use features like automated lane keeping and adaptive cruise control once they are out of the showroom and into daily traffic.
Size, speed, and why some cars turn crashes into catastrophes
Looking across the fatal crash rankings, a pattern emerges that has little to do with brand loyalty and everything to do with physics. Analysts point out that small SUVs and subcompact cars show disproportionately high fatality rates, with vehicle size and weight playing crucial roles in crash outcomes. That is why a light, short wheelbase model like the Hyundai Venue can end up leading the pack in deadly crashes per mile, while larger, heavier vehicles often give occupants more of a buffer in high speed impacts, even if they are not immune to rollovers or multi vehicle pileups.
Performance and driver behavior also matter. The presence of the Chevrolet Corvette and Porsche 911 near the top of the fatality list suggests that speed and risk taking are part of the story, especially when powerful cars are driven on public roads rather than closed tracks. A widely shared breakdown of the data notes that speeding contributes to roughly one third of all roadway deaths, while distracted driving accounts for about 8% of fatal accidents, and it singles out “Four other vehicles, the Chevrolet Corvette, Mitsubishi Mirage, Porsche, Honda CR, Hybrid” as examples of models where design and driver behavior combine to push fatality rates far above average.
From crash stats to premium hikes: how insurers price the risk
For drivers, all of these rankings eventually show up in one place: the insurance bill. Companies do not just look at a driver’s personal record, they also factor in how often owners of a given model crash, how severe those crashes are, and how expensive the repairs tend to be. One data center that tracks these trends defines “at-fault accidents” as the proportion of drivers reporting an at-fault accident on their record compared with the total number of drivers, and uses that share to help explain why some models and brands carry higher premiums than others, a methodology laid out in its at-fault accident definitions.
Those risk based adjustments are landing at a time when many households already feel squeezed by rising insurance costs. A recent look at inflation’s impact on retirees notes that “Car insurance data comes from Insurify’s database of more than 97 m quotes,” and that older homeowners are seeing premiums climb at the same time as other essentials, from groceries to medical care, are getting more expensive. That Car insurance analysis underscores why it matters whether a model like the Kia Soul EV or Hyundai Venue shows up on multiple high risk lists, because those labels can translate into real dollars over the life of a loan.
Why some “safe” choices still rack up crashes
One of the more surprising threads in the data is how often practical, family friendly vehicles show up near the top of accident rankings. The Kia Soul EV, for example, is marketed as a compact, efficient runabout, yet it leads the accident rate list with 15.14% of insured vehicles involved in crashes in 2024, according to the Kia Soul EV rankings. Analysts suggest that vehicles used heavily for urban commuting, rideshare work, or dense city parking simply have more exposure to low speed collisions, even if their fatal crash rates are not as extreme as some sports cars or tiny crossovers.
Similarly, the Honda CR-V Hybrid appears in the group of models with fatality rates more than 4.5 times the industry average, despite its reputation as a sensible family SUV. The broader Highlights from that fatal crash study point again to vehicle size and weight as key factors, especially when smaller crossovers tangle with full size pickups or SUVs. It is a reminder that safety ratings, which often focus on how a car performs in standardized tests, do not always capture how it fares in the messy mix of real world traffic, driver behavior, and road conditions.
What drivers can actually do with all this data
For shoppers, the flood of rankings can feel overwhelming, but there are a few practical takeaways. First, it is worth looking beyond star ratings and asking how a specific model performs in both accident frequency and fatal crash statistics, especially if it shows up repeatedly in lists of the most dangerous or most accident prone vehicles. Checking whether a car like the Hyundai Venue, Chevrolet Corvette, Mitsubishi Mirage, Porsche 911, or Honda CR-V Hybrid appears in the upper tier of fatal crashes per billion miles, as laid out in the fatality analysis, can help buyers weigh the tradeoff between style, performance, and risk.
Second, drivers should remember that behavior still matters more than badges. The same insurance data that calls out Tesla, Ram, and Subaru for high incident rates also shows that brands like Mercury, Pontiac, and Cadillac have much lower shares of drivers with crashes or violations, even though they share the same roads. The broader crash statistics underline that speeding and distraction are still major drivers of fatal accidents, regardless of what is parked in the driveway. In other words, the new report may reshuffle which cars look riskiest on paper, but the biggest shock is how much of that risk still comes down to the person behind the wheel.
More from Wilder Media Group: