
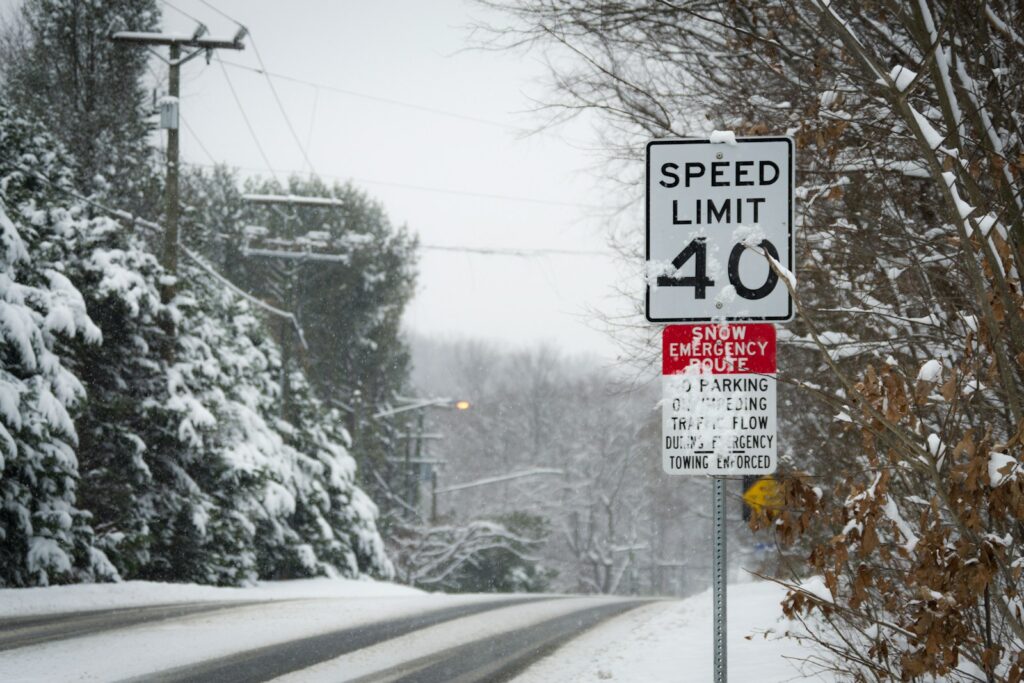
A 5mph change to posted speed limits could alter how you drive, how long your trips take, and how agencies set and enforce limits. If the change moves forward, expect narrower margins for speeding, updated signs on highways, and a likely shift in enforcement and engineering decisions that influence everyday travel.
This post breaks down which roads may be affected, how the change could influence crash risk and traffic flow, and what it means for enforcement and policy so you can judge how it will touch your routine.
Key Details and Scope of the 5mph Speed Limit Change
This change narrows how posted speed limits are set on certain highways and gives agencies specific tools and conditions to lower limits by 5 mph. It affects state and local highways where vulnerable road users concentrate and changes how engineering surveys factor in safety for pedestrians and cyclists.
States and Highways Affected
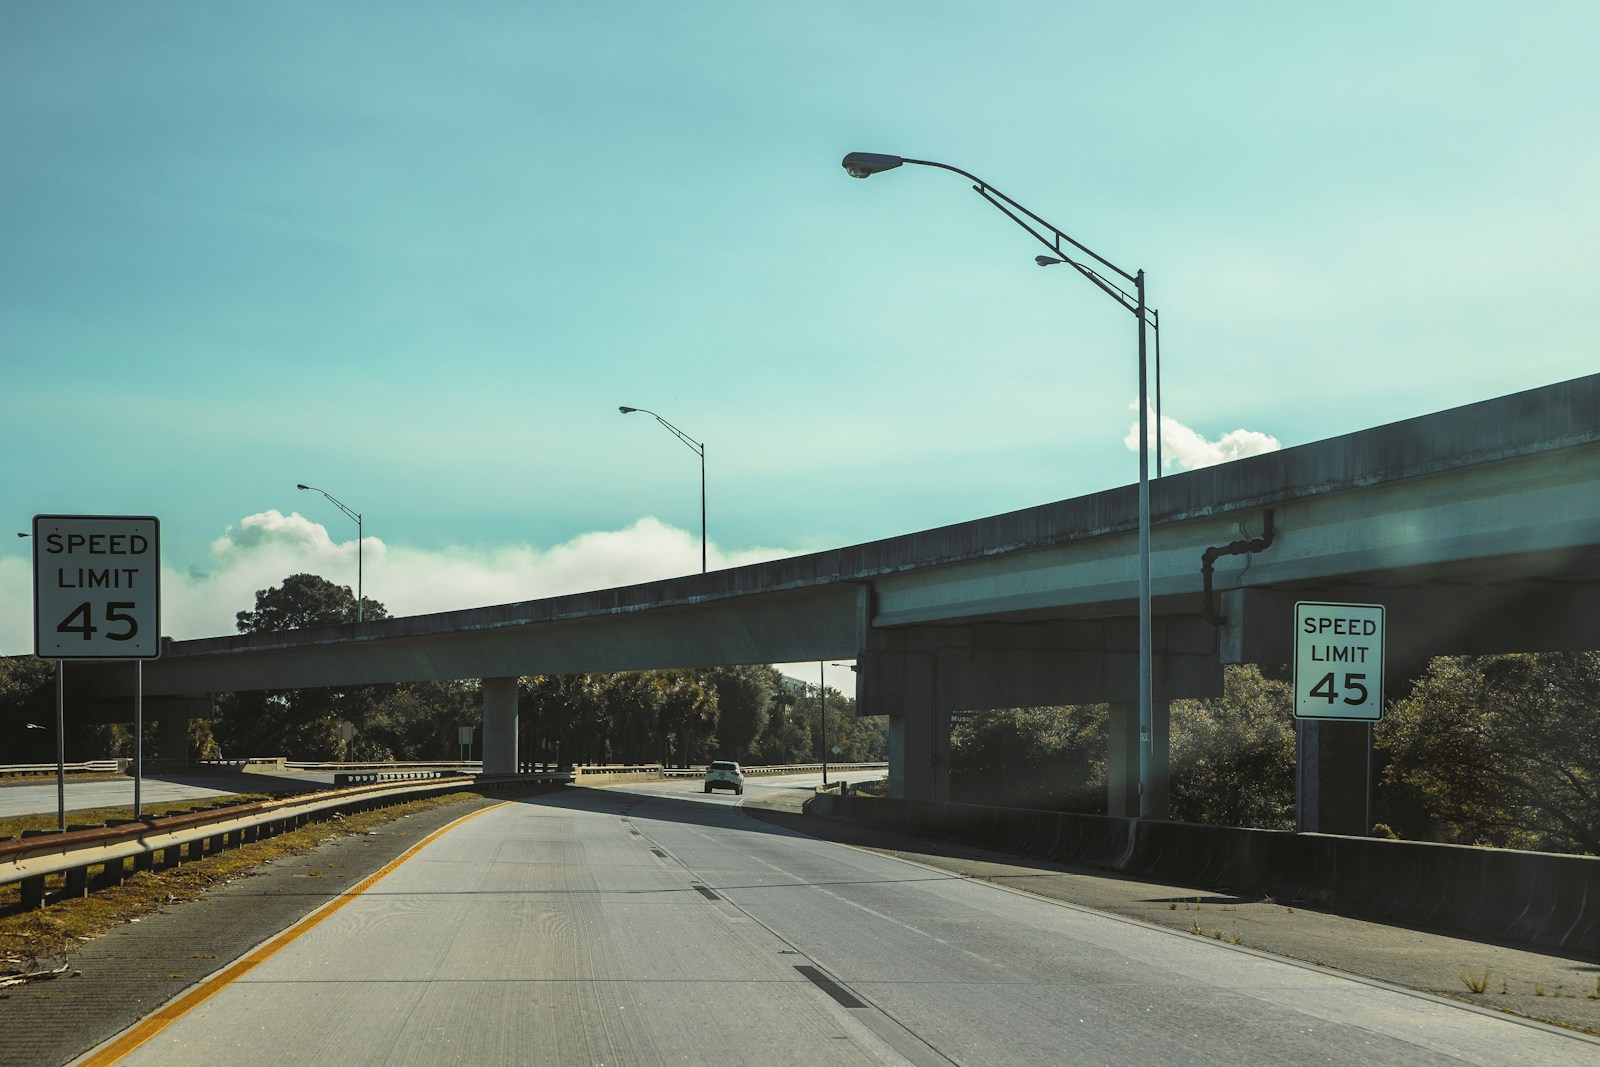
California leads the change, where the law lets local authorities and Caltrans reduce a posted speed by 5 mph on designated safety corridors with high concentrations of pedestrians and bicyclists. The revision modifies the traditional 85th percentile approach and the requirement to round to the nearest 5 mph, so you may see lower posted speed limits on urban arterials and some state highways.
Other states are watching similar debates about the 85th percentile rule and local discretion, though implementation details vary by state law and agency practice. Where allowed, expect reductions to appear mainly on multi-lane urban highways, near schools, and on corridors with documented crash histories involving vulnerable users.
How the Speed Limit Change Is Being Implemented
The change relies on engineering and traffic surveys that explicitly include safety for pedestrians and bicyclists alongside vehicle speeds. When an authority finds a speed “more than reasonable or safe,” it can lower the posted limit by 5 mph by ordinance or administrative action.
Initial rollouts include a 30-day warning-citation window in some jurisdictions to inform drivers before strict enforcement starts. Caltrans and local agencies will typically document the rationale—speed data, crash records, and roadway context—when updating signs so you can review why a particular segment was revised.
Role of the Transportation Committee in the Process
Transportation committees at the state level review, amend, and advance bills that change how posted speed limits are set. They evaluate technical analyses, public testimony, and studies comparing the 85th percentile method with safety-focused approaches.
Committees also shape implementation language: whether agencies may round speeds down, the criteria for designating safety corridors, and requirements for pilot programs such as work-zone speed-safety systems. Their oversight influences how quickly your local agency can change posted limits and what data the agency must produce to justify the change.
Potential Impact on Safety, Travel, and Road Policy
A 5 mph change shifts collision risk, driver behavior, and enforcement needs in measurable ways. Expect changes in average speeds, compliance rates, and the data agencies use when setting future limits.
Road Safety and Crash Statistics
Lowering or raising limits by 5 mph affects crash severity more than crash frequency in many cases. Even small speed increases raise kinetic energy at impact, which increases the chance of serious injury. You should watch for changes in both crash counts and injury severity after implementation.
Agencies typically analyze before-and-after crash data for 3–5 years to detect trends. Look for reductions in high-severity crashes on corridors with mixed pedestrian and vehicle use, and monitor whether median speeds shift or if variability between vehicles changes. If variability grows, crash risk often increases even when average speeds change little.
Perspectives from the Insurance Institute for Highway Safety
The Insurance Institute for Highway Safety (IIHS) links higher speeds to greater crash severity and worse outcomes for vehicle occupants and vulnerable road users. You should expect IIHS to emphasize crashworthiness limits: vehicles protect occupants less well at higher impact speeds.
IIHS research also connects speed management to the broader safety ecosystem—vehicle design, enforcement, and road engineering. When reviewing policy changes, prioritize metrics IIHS tracks: fatality rates per mile, pedestrian and bicyclist injuries, and changes in vehicle occupant injury severity. Those metrics help you judge whether a 5 mph shift produces meaningful public-safety gains.
Debating the Effectiveness of Speed Limits and Control
Speed limits matter, but their effect depends on credibility, design, and enforcement. Drivers respond to limits they see as appropriate; raise limits and compliance often improves, lower limits and violations may increase unless accompanied by engineering and enforcement changes.
You should consider nonregulatory measures—targeted enforcement, automated speed cameras, and physical calming—to reduce speeds reliably. Studies show mixed crash outcomes after posted limit changes, so pair limit changes with engineering (lane narrowing, sidewalks) and data-driven enforcement to achieve desired safety results. Communicate clearly with the public to preserve the perceived legitimacy of the new limits.
Implications for Future Speed Limit Setting
A 5 mph change will prompt agencies to refine how they set and review limits. Expect greater use of integrated approaches combining operating speeds, roadside context, pedestrian exposure, and crash history when deciding limits.
You should push for post-implementation monitoring plans: speed distribution plots, violation rates, and segmented crash analyses. Use iterative reviews—adjust signage, enforcement levels, and roadway design if targeted safety outcomes don’t materialize. Agencies that adopt this evidence-led process will better align speed limits with both mobility goals and safety priorities.
- Key measures to track:
- Average and 85th percentile speeds
- Percent of vehicles exceeding limit by more than 10 mph
- Severe-injury and fatal crash counts
- Pedestrian/cyclist-involved incidents
For more on the link between speed and safety, see research on the relationship between speed and roadway safety (https://www.fhwa.dot.gov/publications/research/safety/17098/003.cfm).
More from Steel Horse Rides: